
Introduction
Most productivity measurement conversations focus on office and hybrid workers—tracking hours logged, collaboration scores, and meeting attendance. But for manufacturing facilities, the challenge is fundamentally different: you're measuring a combination of machine performance and human output, often with legacy equipment, skills gaps, and real-time production pressures that standard frameworks simply don't address.
The shop floor doesn't fit neatly into knowledge-worker productivity models. When a CNC machine sits idle, when scrap rates climb, or when operators wait for programs or materials, those losses don't show up in hours-worked metrics.
Poor visibility into these issues costs the discrete manufacturing sector an estimated $245 billion annually in unplanned downtime alone. That number reflects exactly why traditional measurement approaches break down on the factory floor.
This post covers the current trends transforming how manufacturers think about workforce productivity, the key metrics that actually matter on the shop floor, and how to build a measurement framework that drives real improvement.
TL;DR
- Workforce productivity in manufacturing ties human output directly to machine performance, quality rates, and throughput—not just hours worked
- Key metrics include OEE, cycle time vs. takt time, first-pass yield, and output per labor hour
- IIoT adoption and skilled labor shortages are pushing manufacturers toward outcome-based measurement over time-based tracking
- Effective measurement requires real-time data collection, clear baselines, and shop-floor-to-front-office visibility
- Modern machine monitoring software bridges legacy equipment gaps and breaks down data silos across the shop floor
What Workforce Productivity Really Means on the Shop Floor
Workforce productivity in manufacturing is not simply output divided by hours worked. It's the efficient conversion of labor, machine time, and raw materials into quality finished parts—with minimum waste and downtime. This definition matters because it captures the reality of shop floor operations: human performance and machine capability are inseparable.
Machine Productivity vs. Workforce Productivity
There's a critical distinction between what equipment is capable of and how effectively operators, technicians, and planners utilize that capability:
- Machine productivity (OEE) measures how well manufacturing equipment is utilized compared to its full potential, calculated as Availability × Performance × Quality
- Workforce productivity measures the growth in output compared to the growth in hours worked—focusing on human efficiency
While distinct, these metrics are deeply interconnected. When machines stop, labor efficiency drops as operators sit idle or engage in non-value-added troubleshooting. Tracking both together reveals where the real bottlenecks live—equipment failures, operator gaps, or scheduling blind spots.

The Shop Floor to Front Office Gap
When productivity data stays on the floor and never reaches production planners or leadership, it creates forecasting errors, scheduling inefficiencies, and reactive management. Data silos between operational technology (OT) and information technology (IT) prevent a unified view of performance, causing manual input, delayed syncing, and decisions made on stale numbers.
A centralized data platform eliminates these disparate tools and silos, reducing errors and bottlenecks. Without this integration, manufacturers discover problems after shifts end rather than addressing them as they happen.
Why Knowledge-Worker Frameworks Fail
Standard productivity frameworks (hours logged, meetings attended, collaboration scores) fail to capture value in a CNC machining or precision manufacturing environment. Manufacturers need real-time, machine-level data tied to human performance indicators:
- Actual cycle times vs. planned cycle times
- Parts produced per hour by operator and shift
- First-pass yield and scrap rates
- Downtime causes and duration
- Machine utilization by job type
These metrics reveal whether operators are maximizing equipment capability, where training gaps exist, and which process changes drive measurable improvement.
Key Trends Reshaping Manufacturing Workforce Productivity
Trend 1: The Skilled Labor Shortage
The U.S. manufacturing sector faces a projected shortfall of 1.9 million unfilled jobs by 2033, according to a 2024 study by Deloitte and The Manufacturing Institute. As of August 2025, approximately 409,000 positions remained unfilled.
This shortage forces manufacturers to squeeze more output from every available operator, making productivity measurement and resource optimization more critical than ever. Demand is growing fastest for roles managing smart connected devices. Existing operators must become more productive through smarter tools and technology — not headcount alone.
Trend 2: IIoT and Real-Time Data Visibility
Industrial Internet of Things (IIoT) technology is accelerating across the shop floor. According to Deloitte's 2025 Smart Manufacturing Survey, 27% of manufacturers are investing specifically in IIoT, while 40% are prioritizing data analytics.
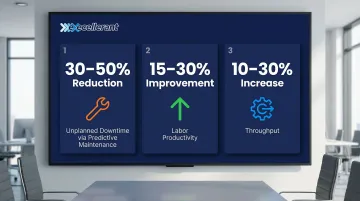
Connecting machines to centralized monitoring platforms enables continuous, automated data collection, replacing clipboard-based tracking and shifting productivity management from reactive to proactive. Manufacturers implementing IIoT and machine monitoring report significant gains:
- 30-50% reduction in unplanned downtime through predictive maintenance
- 15-30% improvements in labor productivity
- 10-30% increases in throughput
Trend 3: The Shift from Time-Based to Outcome-Based Measurement
Leading manufacturers are moving away from measuring productivity by labor hours alone and toward measuring outcomes — parts produced, quality rates, on-time delivery — as more meaningful indicators of workforce performance.
Deloitte's Productivity+ framework moves beyond hours worked to focus on outcomes: the ability to balance time for focus, collaboration, and value generation. On the shop floor, this translates directly — the measure shifts from "time on machine" to "value produced."
The data backs this up:
- Best-in-Class manufacturers using advanced analytics and outcome-focused strategies achieve 39% greater OEE than their peers
- In the pharmaceutical sector, digitized factories post OEE rates 1.75 times higher than the industry average
Trend 4: Automation and Human-Machine Collaboration
Increasing automation is changing the role of the manufacturing workforce. Operators are increasingly responsible for overseeing multiple machines, programming CNC equipment, and interpreting performance data. A McKinsey study found that while fewer than 5% of occupations can be entirely automated, about 60% of occupations could have 30% or more of their activities automated.
This shift demands new productivity metrics that measure operator effectiveness, not just machine cycle counts:
- Number of machines managed per operator
- Time spent on value-added vs. non-value-added activities
- Data interpretation accuracy
- Exception handling response time
- Programming efficiency and error rates
Trend 5: Data-Driven Production Forecasting
Real-time productivity data is enabling manufacturers to move from gut-feel scheduling to confident production forecasting. McKinsey research shows digital manufacturing solutions deliver 85% more accurate forecasting.
Top-performing manufacturers use machine learning to analyze production data, making them 55% more likely to rely on advanced analytics than their peers. Real-time monitoring to predict asset failure drives a 9% year-over-year drop in unplanned downtime — while peers report no improvement at all. That gap compounds quickly.
The Metrics That Actually Matter: Measuring Manufacturing Productivity
OEE (Overall Equipment Effectiveness)
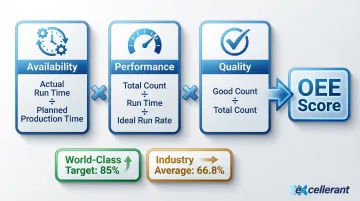
OEE is the manufacturing industry's gold-standard productivity metric—a composite of three factors:
- Availability: Actual run time ÷ Planned production time
- Performance: (Total Count ÷ Run Time) ÷ Ideal Run Rate
- Quality: Good Count ÷ Total Count
OEE captures both machine and workforce effectiveness in a single number. The 85% OEE benchmark was originally defined by Seiichi Nakajima in his 1984 book Introduction to TPM and remains the standard target for high-performing facilities. In contrast, the average OEE for discrete manufacturing organizations is approximately 66.8%.
Machine Utilization Rate
Machine utilization measures the percentage of available time a machine is actively running on productive work. The difference between planned downtime (maintenance, changeovers) and unplanned downtime (breakdowns, material delays) is essential for identifying where workforce interventions can drive the most improvement.
High utilization doesn't always mean high productivity—a machine can run continuously while producing scrap. That's why utilization must be tracked alongside quality metrics.
Cycle Time vs. Takt Time
- Takt time: Available production time divided by customer demand—it sets the pace to meet customer requirements
- Cycle time: How long it actually takes to produce one part
The gap between these two metrics reveals workforce productivity issues—whether in operator pacing, machine programming, or workflow sequencing. When cycle time exceeds takt time, you're falling behind customer demand. When it's significantly below, you may have capacity for additional work.
First-Pass Yield and Scrap Rate
First-pass yield (FPY) is the percentage of parts produced correctly the first time without rework. High scrap rates or rework volumes mask productivity losses that raw output numbers miss—a problem that hits especially hard in aerospace, defense, and medical device manufacturing, where rework carries both cost and compliance consequences.
In high-precision industries, leading manufacturers target FPY above 99%. A representative benchmark for general manufacturing sits around 92%.
Output per Labor Hour
Output per labor hour is the most direct measure of workforce productivity: good parts (or dollar value of output) produced per hour of labor invested. Tracking it by machine type, shift, and operator surfaces performance patterns and pinpoints where coaching or process changes will have the most impact.
Key dimensions to track:
- By machine type — reveals which equipment drives the most output per hour
- By shift — identifies crew-level performance gaps or scheduling inefficiencies
- By operator — supports targeted coaching and skills development
U.S. manufacturing labor productivity increased 3.7% in the third quarter of 2025, as output increased 3.0% and hours worked decreased 0.7%.
Building a Manufacturing Productivity Measurement Framework
Step 1: Define Role-Specific Goals and Baselines
Before tracking anything, establish what "good" looks like for each machine type, product family, and operator role. Collect baseline data over 30–90 days to account for normal variation in job mix and machine load. Without baselines, improvement is impossible to demonstrate.
Set realistic targets based on:
- Historical performance data
- Industry benchmarks
- Equipment specifications
- Product complexity
Step 2: Implement Automated Data Collection
Manual data entry is prone to delay and inaccuracy. Operators are too busy producing parts to consistently log data, which means issues surface hours or shifts after they occur rather than in real time.
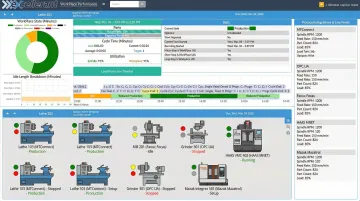
Modern platforms can connect legacy CNC machines—without native networking capability—to real-time monitoring dashboards, eliminating the need to replace equipment to gain data visibility. External machine monitoring hardware reads signal-level data (spindle on/off, door open/close, program run status) and transmits it wirelessly or via direct connection.
That universal connectivity is a core strength of Excellerant's platform, which integrates any mix of machines regardless of brand or age. Supported protocols include:
- MTConnect
- OPC UA
- Fanuc Focas
- HAAS MNET
- Mazak Mazatrol
Step 3: Create a Review Cadence and Action Loop
Data collection only creates value when it drives decisions. Establish a practical review cadence:
Daily Production Huddles:
- Use real-time dashboards to review previous shift performance
- Identify immediate issues and assign corrective actions
- Review current shift priorities and resource allocation
Weekly Trend Reviews with Supervisors:
- Analyze OEE trends by machine and operator
- Identify recurring downtime causes
- Review first-pass yield and scrap patterns
- Adjust schedules and priorities based on capacity
Monthly Reporting to Leadership:
- Review overall productivity trends
- Assess progress toward goals
- Identify investment priorities
- Adjust baseline targets as processes improve
The cadence only works when each level acts on what the data shows — not just reviews it.
Overcoming Common Measurement Challenges in Manufacturing
Challenge 1: Legacy Machines with No Native Data Output
Many machine shops run older CNC equipment that cannot natively report runtime, cycle counts, or fault codes. The average age of CNC machines in production facilities is currently 8.7 years, and approximately 64% of manufacturers rate their shop-floor IT capabilities as just average, weak, or non-existent.
The solution: External machine monitoring hardware that reads signal-level data and transmits it wirelessly or via direct connection—making legacy machines just as visible as newer equipment. These systems connect through existing serial communications ports or by adding a PLC as an intermediary device, without requiring machine modifications or replacements.
Challenge 2: Operator Resistance and Cultural Change
Productivity monitoring can feel threatening to experienced machinists. Frame measurement as a tool for removing obstacles—downtime, material shortages, poor tooling—rather than monitoring individuals.
Practical approaches:
- Involve operators in identifying what metrics matter most for their stations
- Show how data helps them hit their numbers and avoid surprises
- Provide real-time feedback so operators can self-correct
- Celebrate improvements and recognize high performers
- Use data to identify training needs, not to punish mistakes
Challenge 3: Data Silos Between the Shop Floor and Front Office
When production data lives only in manual logs or isolated machine displays, planners and managers can't act on it in time. Integrating shop floor data with ERP systems and production scheduling tools closes this loop—improving both real-time responsiveness and long-term forecasting accuracy.
The solution: Modern machine monitoring platforms offer two-way integration with major ERP systems like SAP and Oracle, ensuring business systems always reflect current shop floor reality. This eliminates manual data entry and gives planners accurate, real-time data to work from—rather than yesterday's estimates.
Frequently Asked Questions
What is the most important productivity metric for a manufacturing workforce?
OEE (Overall Equipment Effectiveness) ranks as the most comprehensive single metric because it combines availability, performance, and quality—capturing both machine and workforce contributions to productive output in one number.
How do you measure workforce productivity on a shop floor?
Effective shop floor measurement combines automated machine data (runtime, cycle time, output counts) with human performance indicators like output per labor hour and first-pass yield. Both are reviewed against established baselines to surface improvement opportunities.
What is the difference between machine utilization and OEE?
Machine utilization measures only whether a machine is running vs. idle, while OEE goes further to also account for whether it's running at full speed and whether it's producing good parts—making OEE a more complete productivity indicator.
How can IIoT technology improve manufacturing workforce productivity?
IIoT-enabled machine monitoring delivers real-time visibility into machine status, downtime causes, and output rates. Supervisors and planners can respond to productivity losses as they happen, rather than discovering them after the shift ends.
What are the biggest challenges to measuring productivity in a machine shop?
Three challenges come up most often: legacy machines without native data output, manual and inconsistent collection practices, and the disconnect between shop floor data and front-office planning systems. That last gap is what most directly delays timely decision-making.
How does real-time machine monitoring support production forecasting?
Continuous capture of cycle times, utilization rates, and downtime events gives production planners a foundation of real performance data instead of estimates. That accuracy translates directly into better on-time delivery rates and more reliable completion time commitments.