
Introduction
Manufacturers today are squeezed from multiple directions at once: customers want shorter lead times, tighter tolerances, and lower prices — while material and labor costs keep climbing. Real-time visibility into whether your production is ahead or behind isn't optional anymore. It's the baseline for staying competitive.
OEE (Overall Equipment Effectiveness) has become a standard metric in manufacturing, but its real value only comes through when it's surfaced live — driving daily decisions rather than filling monthly reports. Without visibility into Availability, Performance, and Quality as they happen, shops are left reacting to problems hours after the damage is done.
A live OEE dashboard changes that equation. It transforms OEE from a retrospective scorecard into an operational tool that every team member — from machine operator to plant manager — can act on throughout the shift.
TL;DR
- An OEE dashboard displays real-time Availability, Performance, and Quality in one view, giving every team member a live view of production health
- Replaces reactive firefighting with proactive decision-making by surfacing losses as they happen, not after the shift ends
- Delivers instant visibility into efficiency losses, faster root cause identification, and more confident production planning
- Shops without OEE dashboards rely on lagging data, making it hard to prevent recurring downtime or hit consistent output targets
What Is a Manufacturing OEE Dashboard?
A manufacturing OEE dashboard is a real-time digital display that calculates and visualizes Overall Equipment Effectiveness (the product of Availability, Performance, and Quality) across machines and lines during scheduled time. It takes raw machine data — runtime, cycle counts, reject signals, status changes — and converts it into clear, decision-ready insight that connects the shop floor to operations.
OEE dashboards typically serve multiple audiences across different contexts:
- Shop floor displays - Operator-facing screens mounted near machines showing live status and performance
- Production meetings - Shift handover reviews and daily standups using historical and real-time data
- Management reporting - Executive dashboards tracking facility-wide performance trends
The real value is visibility. OEE dashboards eliminate the "black box" factory floor by making equipment performance transparent — so teams can spot where production is losing ground before those losses compound into missed deliveries or unplanned overtime.
Key Advantages of Manufacturing OEE Dashboards
These advantages are grounded in measurable operational impact: cost, uptime, throughput, and quality. They compound over time when dashboards are connected to accurate machine data and reviewed as part of daily production discipline.
Real-Time Visibility Across All Three OEE Components
The primary advantage of an OEE dashboard is eliminating the "black box" factory floor. Operators and managers can see in real time whether a machine is running, at what speed, and producing how much good output, all on a single screen.
What operators see in real time:
Machine data flows continuously into the dashboard through automated collection systems that capture runtime, cycle counts, and reject signals. The dashboard calculates live Availability, Performance, and Quality scores that update throughout the shift rather than appearing only at day's end. This continuous calculation means supervisors know immediately when performance drops, not hours later when reviewing paper logs.
Why this matters:
Without real-time OEE visibility, efficiency losses compound silently. A machine running at 70% performance for a full shift can erase hours of planned output before anyone notices. Unplanned machine downtime costs U.S. manufacturers an estimated $50 billion annually, with hourly costs ranging from $10,000 for smaller shops to over $2.3 million in high-volume sectors like automotive. Real-time visibility prevents these silent losses from accumulating unchecked.

KPIs impacted:
- Machine utilization rate
- Planned vs. actual output
- Shift efficiency
- Quality yield rate
When this advantage matters most:
High-volume, multi-machine environments where supervisors cannot physically monitor every asset simultaneously benefit most from real-time dashboards. Facilities running multiple shifts where handover accuracy is critical also see significant value, as incoming teams can immediately see what happened during the previous shift without relying on incomplete handwritten notes.
Faster Root Cause Identification and Downtime Reduction
OEE dashboards don't just show that performance dropped. They record when, for how long, and on which asset, turning root cause analysis into a matter of reviewing logged data rather than reconstructing events from memory.
Surfacing invisible losses:
Dashboards capture micro-stops and slow cycles that would otherwise be invisible in standard production reports. A machine that stops for 90 seconds every 20 minutes rarely triggers an alarm, but these brief interruptions can reduce Performance scores significantly over a shift. Micro-stops can account for up to one-third of planned run time, representing a massive layer of productivity loss that manual tracking simply cannot capture.
Why this matters:
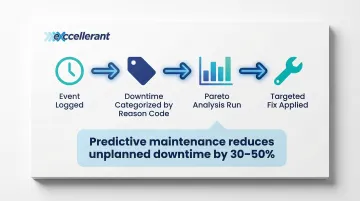
When dashboards log every stoppage with timestamps and duration, teams can identify the most frequent or costly loss reasons using Pareto analysis. This enables targeted maintenance or process changes rather than reacting to problems after they've compounded. Predictive maintenance enabled by real-time monitoring can reduce unplanned downtime by 30-50% and maintenance costs by 12-40%.
KPIs impacted:
- Mean time to repair (MTTR)
- Unplanned downtime hours
- Downtime frequency by reason code
- Maintenance response time
When this advantage matters most:
Shops experiencing frequent unexplained output misses benefit immediately from detailed downtime logging. Facilities transitioning from reactive to preventive maintenance use dashboard data to identify which assets need attention before they fail. Operations where shift handovers historically lose context about what went wrong see dramatic improvements in troubleshooting speed.
Data-Driven Production Planning and Forecasting
Historical OEE data captured by the dashboard builds a reliable baseline for each machine and cell, allowing production planners to schedule jobs against realistic capacity rather than theoretical maximums.
What planners actually see:
When ERP and scheduling systems are fed actual OEE-informed capacity data, delivery commitments become more accurate and expediting costs fall. Planners can see that a particular machine consistently runs at 75% of its rated speed and adjust schedules accordingly.
This matters because most delivery promises are still built on optimistic assumptions. When actual throughput data replaces those assumptions, the gap between promised and shipped dates closes.
Why this matters:
Discrete manufacturers typically operate at an average OEE of 60-75%, significantly below the 85% considered world-class. This 10-25 percentage point gap represents substantial lost productive capacity that's often masked by manual reporting. When planning systems use actual OEE baselines instead of theoretical capacity, the gap between planned and actual output shrinks dramatically.
- On-time performance: Manufacturers with consistently high OEE typically achieve 95%+ On-Time-In-Full (OTIF)
- ERP accuracy: Machine monitoring data fed directly to ERP eliminates the disconnect between shop floor reality and enterprise planning
- Forecasting confidence: Schedules built on measured capacity reflect what machines actually produce, not what they're rated to produce
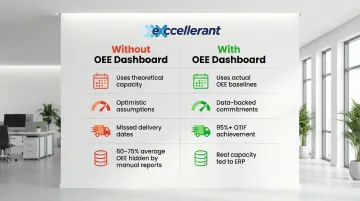
When machine monitoring connects directly to ERP, the traditional separation between shop floor reality and enterprise planning disappears. Delivery commitments become data-backed rather than estimate-based.
KPIs impacted:
- On-time delivery rate
- Schedule adherence
- Capacity utilization
- ERP data accuracy
When this advantage matters most:
Contract manufacturers, aerospace, defense, and medical device shops where delivery precision and traceability are contractual requirements see immediate value. Any facility scaling production volume without adding headcount benefits from data-driven capacity planning that identifies bottlenecks before they become crises.
What Happens When OEE Dashboards Are Missing or Ignored
Operating without real-time OEE visibility creates predictable, costly consequences. Output targets are missed and the cause isn't understood until it's too late to recover the shift. Downtime events go uncategorized, making it impossible to identify whether losses are systematic or random. Performance gaps are attributed to operator error when the real cause is a tooling or cycle time issue that could be fixed with proper data.
The Cost of Operating Blind
Without machine-level data feeding a dashboard, shops typically rely on paper logs or end-of-shift reports—both of which suffer from delay, inconsistency, and omission. A 2025 report found that 54% of factories worldwide still rely on spreadsheets to manage work orders, production schedules, and downtime tracking.
This leaves management making capacity decisions on incomplete information, resulting in chronic schedule misses and firefighting that could have been prevented with earlier visibility.
The Connectivity Gap
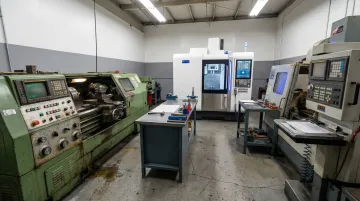
Many shops run mixed or legacy equipment—machines that predate IIoT adoption and don't emit data automatically. The median age of CNC machine tools in U.S. job shops is seven years, and 62% of shops still operate manual lathes and milling machines alongside their CNCs. This creates a real connectivity gap—but machine monitoring platforms built for mixed environments address it directly.
These platforms connect any machine brand or protocol through serial communications, PLCs, or hardware adapters. Even older CNC equipment without native data output can feed a live OEE dashboard, giving production managers visibility across every asset on the floor—not just the newest ones.
How to Get the Most Value from Your OEE Dashboard
An OEE dashboard delivers compounding value when it's connected to reliable, real-time machine data. The quality of insight depends entirely on the quality of the data feed — which means investing in machine connectivity that captures runtime, cycle counts, and status changes accurately across every asset, including older CNC equipment that may not have native data output capabilities.
Review the Data on a Schedule — Then Act on It
Dashboards work best when reviewed consistently. Daily shift reviews using downtime reason codes and Pareto data narrow the gap between planned and actual OEE over time. Reviewing the data without acting on recurring loss patterns, though, leads to a plateau. The dashboard surfaces the opportunity — the productivity gain only materializes when that data informs maintenance schedules, operator training, job sequencing, and production commitments.
Turn Dashboard Visibility Into Daily Operating Discipline
Treat the dashboard as an ongoing operational practice, not a one-time implementation milestone. Teams that use OEE data to drive decisions see improvements that build on each other:
- Schedule preventive maintenance before failures occur, not after
- Adjust job sequences to minimize changeover losses
- Target operator training toward the specific issues driving the most downtime
Companies with real-time visibility of quality metrics outperform others by 6% in OEE, and case studies show OEE gains of 15–30% are achievable when dashboards are connected to accurate machine data and reviewed as part of daily production discipline.
Conclusion
Manufacturing OEE dashboards give every team member — from operator to plant manager — a shared, real-time view of where production stands and where it's losing ground. That shared visibility is what shifts manufacturing from reactive firefighting to deliberate, proactive decision-making.
The gains — faster root cause analysis, tighter forecasting, reduced unplanned downtime — build on each other over time. That compounding only happens when the dashboard is tied to accurate machine data and reviewed as part of daily production discipline. Platforms like Excellerant's connect directly to CNC machines of any brand or age, ensuring the data feeding your OEE dashboard is reliable from the first shift. The result is a shop floor that doesn't just track performance — it improves it, consistently.
Frequently Asked Questions
What is an OEE dashboard?
An OEE dashboard is a real-time digital display showing Overall Equipment Effectiveness—calculated from Availability, Performance, and Quality—giving operators, supervisors, and managers a clear view of how productively equipment is running. It converts raw machine data into actionable insight without requiring manual analysis.
How to measure OEE in manufacturing?
OEE is calculated using the formula: Availability × Performance × Quality. Each factor is expressed as a percentage, and multiplying all three gives you a single score that reflects true productive output against maximum possible output.
What are the three components of OEE?
The three components are Availability (equipment uptime versus scheduled time), Performance (actual throughput rate versus ideal rate), and Quality (good output versus total output). Each component targets a different type of production loss: downtime, slow cycles, and defects.
What is a good OEE score in manufacturing?
An OEE score of 85% is recognized as world-class, while scores in the 60–75% range are more typical for discrete manufacturing. The more important benchmark is consistent improvement against a facility's own historical baseline—steady upward movement over 90-day intervals signals that process changes are actually sticking.
How do OEE dashboards help reduce machine downtime?
OEE dashboards log every downtime event with a timestamp and duration, enabling teams to identify the most frequent or costly loss reasons using Pareto analysis. Teams can then target those specific issues through maintenance or process changes rather than reacting to problems after they've compounded.
Can OEE dashboards connect to legacy CNC machines?
Yes, modern machine monitoring platforms are designed to collect data from any machine regardless of brand, age, or control type. Legacy CNC equipment without native IIoT capability can still feed an OEE dashboard through external sensors, hardware adapters, serial communications, or PLCs that bridge the connectivity gap.