Introduction
Automotive manufacturers lose $2.3 million per hour when production stops unexpectedly. For most industrial operations, the median is still $125,000 per hour — and yet 80% of industrial organizations run with limited to no visibility into their operational technology environments. Without monitoring, teams aren't managing risk. They're waiting for something to break.
Without real-time data, early warning signs — cycle time drift, temperature spikes, network latency — go undetected until production halts completely.
This article covers industrial IoT (IIoT) system monitoring in manufacturing: the metrics that matter, the practices that protect uptime, and strategies for scaling visibility across both new and legacy equipment.
TLDR:
- Unplanned downtime costs industrial operations $125,000/hour on average — $2.3M/hour in automotive
- Predictive maintenance reduces machine downtime by 30-50% compared to reactive approaches
- Effective monitoring requires tracking OEE, cycle time deviation, connectivity health, and device status
- Legacy machine integration through protocol translation enables complete shop floor visibility
- Network segmentation and tiered alerting prevent both security risks and alert fatigue
What Is IoT System Monitoring in Manufacturing?
IoT system monitoring in the industrial context means continuously collecting and acting on data from connected machines, sensors, and networks. The goal is straightforward: keep equipment running, production on schedule, and machine data accurate. Unlike consumer IoT, which focuses on convenience, IIoT monitoring directly impacts production continuity—a missed alert or connectivity gap translates immediately to lost revenue and delayed orders.
Key Components of an IIoT Monitoring System
A typical IIoT monitoring system operates across three architectural layers:
- Edge layer: Sensors and CNC machines collect raw data (vibration, temperature, cycle counts, machine states)
- Gateway layer: Aggregates and transmits data from multiple machines, handling protocol translation and buffering
- Platform layer: Dashboards, alerting engines, and analytics tools that turn data into decisions
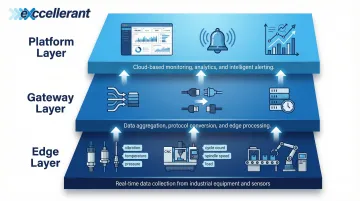
Gaps at any layer create monitoring blind spots. A failed gateway means machines appear healthy simply because they've stopped reporting. A misconfigured edge sensor produces false readings that mask real problems. Both scenarios are silent failures — and in a production environment, silent failures are the most costly kind.
Active Monitoring vs. Passive Data Collection
Passive data logging records what happened—useful for compliance and trend analysis. Active monitoring detects deviations and triggers alerts in real time, enabling immediate response before failures cascade. Manufacturing operations need both: historical data reveals patterns (like gradual tool wear), while real-time alerting catches sudden failures (like spindle overheating or network dropouts). Together, they give shop floor teams both the early warning they need and the historical context to understand why failures occur.
Key Metrics to Monitor in an IIoT System
Not all data is equally actionable. Effective monitoring starts with identifying the right metrics—those directly tied to production output, equipment health, and system reliability.
Machine Availability and Uptime
Machine availability measures the percentage of scheduled production time a machine is actually operational. Tracking planned vs. unplanned downtime separately matters because the root causes differ: planned downtime reflects maintenance strategy, while unplanned downtime signals equipment failure, process issues, or supply problems.
The cost of getting this wrong is substantial. Recent industry data shows:
- Automotive sector: $2.3 million per hour in unplanned downtime costs
- Typical manufacturing: $125,000 per hour median cost
- Heavy industry: $59 million annually per facility
At $125,000 per hour, an eight-hour outage can cost a typical business $1 million — which makes continuous availability monitoring less optional than it sounds. Teams that track failure patterns proactively can schedule maintenance during planned windows rather than reacting to breakdowns.
Overall Equipment Effectiveness (OEE)
OEE is the most widely used KPI in manufacturing monitoring because it captures machine, process, and quality issues in a single number. It's calculated as:
OEE = Availability × Performance × Quality
Where:
- Availability: Run Time ÷ Planned Production Time
- Performance: (Ideal Cycle Time × Total Count) ÷ Run Time
- Quality: Good Count ÷ Total Count
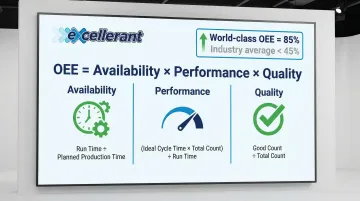
World-class OEE is 85%, while typical manufacturing operations hover closer to 60%, with the industry average often sitting below 45%. Platforms like Excellerant's real-time machine data collection system surface OEE components continuously through machine performance dashboards, utilization charts, and shift-by-shift breakdowns.
This visibility gives production managers the data needed to act before OEE degrades by pinpointing which of the Six Big Losses is driving underperformance: equipment failure, setup delays, idling, speed loss, startup defects, or production rejects.
Cycle Time and Throughput Deviation
Monitoring actual cycle time against target cycle time reveals early signs of tool wear, spindle issues, or program errors that won't yet trigger a fault alarm but will erode efficiency over time. Research on pneumatic drive systems demonstrates that cycle time deviations as small as 5% can detect specific mechanical faults like external leakage—well before catastrophic failure occurs.
Fault-free operations typically maintain cycle time within ±2%. When deviations exceed this threshold consistently, it signals:
- Tool wear requiring replacement
- Hydraulic or pneumatic pressure loss
- Spindle bearing degradation
- CNC program inefficiencies
Configure alerts for sustained cycle time drift. A machine running 5-8% slower than baseline won't stop production today, but it indicates developing problems that will cause unplanned downtime tomorrow.
Network and Connectivity Health
In IIoT, a "healthy" machine reading is worthless if the data pathway is compromised. Connectivity failures upstream of the dashboard create false "healthy" readings—a machine that appears running may have simply stopped reporting.
Monitor these connectivity-layer metrics:
- Gateway latency: Time delay between data generation and dashboard display
- Packet loss: Percentage of data packets that fail to reach destination
- Device heartbeat intervals: Regular "alive" signals from sensors and machines
- Communication dropouts: Frequency and duration of connection interruptions
NIST SP 800-82r3 emphasizes that OT systems often have real-time requirements where delay and jitter are unacceptable, recommending continuous security monitoring to detect anomalies in network traffic. Additionally, 53% of OT service engagements uncover uncontrolled external connections—a significant security and reliability risk.
Implement heartbeat monitoring for all gateways and sensors. If a heartbeat is missed, flag a connectivity failure immediately rather than assuming the machine is idle.
Sensor and Device Health Indicators
The monitoring layer needs oversight too — silent sensor failures are easy to miss. Track these device-level health signals:
- Battery status: For wireless sensors, low battery warnings prevent data gaps
- Firmware version currency: Outdated firmware introduces performance degradation and security vulnerabilities
- Signal strength: Weak signals cause intermittent data loss
- Error logs: Device-level fault codes reveal hardware issues before complete failure
Platforms with per-machine event logging and device connectivity history give IT teams the tools to detect degrading device performance before it impacts production visibility. Without device health monitoring, you have no visibility into whether your monitoring system itself is reliable.
Essential IoT System Monitoring Best Practices
Six practices define whether an IIoT monitoring program actually works in production — or just looks good on paper.
Establish Performance Baselines Before Setting Thresholds
Alert thresholds set without baseline data produce noise (too many false alarms) or silence (missed real issues). Run machines under normal conditions for 30 days to capture baseline metrics:
- Cycle times under typical load
- Temperature ranges during standard operations
- Vibration patterns for healthy equipment
- Connectivity metrics during production hours
Only after establishing baselines should you configure alert rules. A 10% cycle time increase might be normal for one machine but catastrophic for another. Baselines provide the context that makes alerts actionable.
Design Alerts for Actionability, Not Completeness
Alert fatigue kills monitoring programs. When every minor deviation triggers a notification, operators stop responding. Apply these principles:
Tier alerts by severity:
- Informational: Logged but no immediate action required (scheduled maintenance due in 7 days)
- Warning: Requires attention within shift (cycle time 5% above baseline)
- Critical: Immediate response needed (machine fault, connectivity loss, safety threshold exceeded)
Route alerts to the right personnel:
- Operators: Machine faults, material shortages, quality issues
- Maintenance: Tool wear, vibration anomalies, predictive maintenance triggers
- IT: Network connectivity, gateway failures, device health issues
- Management: Production delays, OEE degradation, capacity constraints
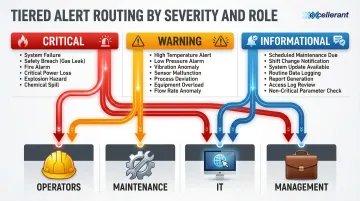
Before any alert goes live, document what it means, who owns it, and what the response steps are. An alert without a defined protocol is just noise.
Apply Regular Firmware and Software Updates Across All Connected Devices
Outdated firmware on IoT gateways and edge devices introduces both performance degradation and security vulnerabilities. Establish a scheduled update cadence:
- Critical security patches: Within 30 days of release
- Feature updates: Quarterly, during planned maintenance windows
- Testing protocol: Validate updates on non-production equipment first
Over-the-air (OTA) update capability should be a selection criterion when choosing monitoring hardware or platforms. Manual firmware updates across dozens or hundreds of devices create deployment delays and version inconsistencies that compromise system reliability.
Segment the OT Network from Corporate IT Infrastructure
Operational technology (OT) networks—where machines and sensors live—should be isolated from the corporate IT network. Flat networks create two major risks:
Security risks: 50% of OT service engagements reveal issues with network segmentation. Threat actors exploit insufficient segmentation to access OT networks via standard user accounts, with ransomware attacks against industrial organizations increasing 87% in 2022.
Performance risks: IT traffic (email, web browsing, software updates) can disrupt time-sensitive machine communications, causing dropped packets and communication delays that appear as machine faults.
NIST SP 800-82r3 explicitly recommends network segmentation using a DMZ (Demilitarized Zone) to prevent direct traffic between corporate IT and the OT network. IEC 62443 advocates for the "Zones and Conduits" model, where assets with similar security requirements are grouped into zones, and communication is strictly controlled via conduits.
Use VLAN segmentation or a dedicated OT network as the standard approach. Controlled gateways between zones enable necessary data exchange (like ERP integration) while preventing threats from spreading laterally across the network.
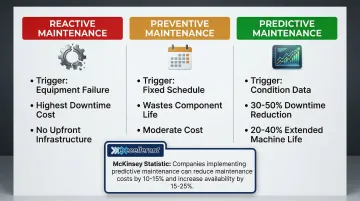
Shift Maintenance Strategy from Reactive to Predictive
Not all maintenance strategies cost the same — in downtime, parts, or labor:
| Strategy | Trigger | Drawback |
|---|---|---|
| Reactive | Failure occurs | Highest cost; unplanned downtime |
| Preventive | Fixed schedule | Replaces components with useful life remaining |
| Predictive | Condition data | Requires monitoring infrastructure upfront |
Predictive maintenance optimizes both cost and uptime by servicing equipment based on actual condition, not assumptions.
Continuous monitoring of vibration, temperature, cycle deviation, and error rates enables condition-based triggers. McKinsey reports that predictive maintenance reduces machine downtime by 30-50% and extends machine life by 20-40%.
Siemens estimates that full adoption could save Fortune Global 500 manufacturers $233 billion annually through reduced maintenance costs alone.
The shift requires:
- Baseline data for normal operating conditions
- Threshold alerts for abnormal conditions (vibration spike, temperature rise, cycle time drift)
- Maintenance protocols triggered by condition rather than calendar
- Integration between monitoring platform and CMMS (Computerized Maintenance Management System)
Document Monitoring Protocols and Train Shop Floor Staff
A monitoring system is only as effective as the people responding to it. Create written runbooks that document:
- What each alert means (technical definition and production impact)
- Who owns the response (operator, maintenance, IT, management)
- What the response steps are (troubleshooting procedure, escalation path)
- How to interpret dashboard data (OEE components, state charts, utilization reports)
Conduct regular training so operators understand how to interpret dashboard data — not just how to acknowledge alarms. Shops that skip this step find themselves with excellent monitoring infrastructure and slow, inconsistent responses to the alerts it generates.
Common Challenges in IIoT Monitoring
Protocol Diversity and Interoperability
Manufacturing floors often contain machines from multiple vendors using incompatible communication protocols: MTConnect, FANUC FOCAS, Haas NGC, Okuma, Modbus, EtherNet/IP, PROFINET, OPC UA. This diversity creates monitoring gaps when platforms only support a narrow set of protocols.
MTConnect has emerged as a key interoperability standard—an open, royalty-free protocol designed to normalize data from different machine brands into a standardized XML or JSON format. It uses adapters (to translate native machine language) and agents (to buffer and serve the data), enabling standardized manufacturing connectivity across vendors.
For shops with mixed fleets, protocol-agnostic monitoring is the only way to achieve complete visibility. Excellerant — a voting member of the MTConnect Standards Committee — built its platform specifically to handle universal machine connectivity across any brand or protocol, including legacy equipment. No machine gets left out of the data picture.
Data Volume and Alert Fatigue
High-frequency sensor data, when undifferentiated, creates noise that obscures meaningful signals. A single CNC machine can generate thousands of data points per minute. Multiply that across dozens or hundreds of machines, and operators are buried in readings rather than actionable insights.
Apply these strategies:
Edge-level filtering: Process and summarize data before it reaches the cloud. Instead of transmitting raw sensor readings every second, transmit summary statistics (average, min, max, standard deviation) every minute, with full detail only when thresholds are exceeded.
Statistical anomaly detection: Use algorithms to identify deviations from normal patterns rather than simple threshold alerts. A temperature that's technically within range but rising faster than normal may indicate developing problems.
Context-aware alerting: Suppress alerts during known conditions (scheduled maintenance, changeovers, startup sequences) to prevent false positives that train operators to ignore notifications.
Security Risks Specific to OT Environments
OT networks have historically been air-gapped and are not designed with cybersecurity in mind. Many industrial devices lack authentication, encryption, or update mechanisms. The convergence of IT and OT has exposed manufacturing environments to threats previously limited to enterprise IT.
Incident statistics:
- Ransomware attacks against industrial organizations increased 87% in 2022
- 72% of all ransomware attacks tracked by Dragos targeted manufacturing entities
- 2,170 vulnerabilities investigated in 2022, up from 703 in 2020
Legacy device gaps:
- 50% of engagements found shared credentials across devices
- 80% of organizations lack full visibility into OT environments
Implement these compensating controls:
- Network segmentation: Isolate OT from IT networks
- Access controls: Require authentication for all device access
- Continuous anomaly detection: Monitor network traffic for unusual patterns
- Regular security audits: Identify and remediate vulnerabilities before exploitation
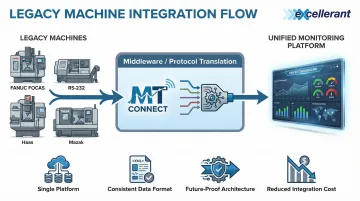
Connecting Legacy and Modern Machines in Your IIoT Monitoring Strategy
Manufacturing floors rarely start with a blank slate. Most shops operate a mix of decades-old CNC machines alongside modern equipment, and legacy machines were never designed with network connectivity in mind. This is one of the most common and underaddressed barriers to comprehensive IIoT monitoring—without legacy integration, your monitoring system has permanent blind spots on the shop floor.
Hardware Adapters and Serial Communication Bridges
Legacy CNC machines that communicate only via RS-232 serial ports or older protocols can be connected to modern IIoT platforms using hardware adapters and serial-to-Ethernet converters. This approach avoids costly machine replacement while achieving full data collection.
Wireless DNC adapters plug into older RS-232 connections, converting legacy serial interfaces to wireless connectivity without extensive cabling. They handle protocol translation at the hardware level — connecting 1980s-era serial communications to modern Ethernet-based monitoring platforms.
Hardware selection matters. The adapter must support the specific protocols your machines use:
- FANUC FOCAS and older Haas control interfaces
- Mazak Mazatrol and similar proprietary formats
- Non-standard serial implementations from niche manufacturers
Generic adapters frequently fail with older equipment. Verify protocol compatibility before purchasing.
Middleware and Protocol Translation
Middleware layers provide software-based protocol translation, converting proprietary machine protocols into normalized data formats that monitoring platforms can consume. Standards like MTConnect serve as the common language—adapters translate native machine protocols into MTConnect format, and monitoring platforms consume the standardized data stream.
Excellerant holds a voting seat on the MTConnect Standards Committee and has been connecting machine tools since 1991 — including legacy equipment that many modern platforms cannot reach. That history translates directly into protocol knowledge: understanding vendor-specific implementations and the quirks of older control systems that documentation rarely covers.
The middleware approach enables:
- Single monitoring platform for all machines regardless of age or manufacturer
- Consistent data format for ERP and MES integration
- Future-proof architecture as new machines are added
- Reduced integration cost compared to custom development per machine type
Validating Legacy Integration Before Going Live
Incomplete legacy integration is worse than no integration because it creates false confidence in monitoring coverage. Once machines are connected, run these validation steps before treating them as fully integrated:
Confirm data accuracy against known machine states:
- Run test programs with known cycle times and part counts
- Verify reported data matches actual machine behavior
- Cross-check against manual logs during validation period
Check for communication dropouts under production load:
- Monitor connectivity during peak production hours
- Test during machine changeovers and program uploads
- Verify data continuity during network congestion
Verify legacy device data populates dashboards correctly:
- Confirm all expected metrics appear in real-time views
- Test alert triggers using simulated fault conditions
- Validate that historical data logs and retrieves without gaps
Only after successful validation should legacy machines be considered fully integrated. Partial integration that passes testing but fails under production load creates blind spots exactly when visibility matters most.
Frequently Asked Questions
What are some IoT best practices?
Core best practices for IoT monitoring include:
- Establish performance baselines before setting alert thresholds
- Tier alerts by severity and route them to the right personnel
- Segment OT networks from corporate IT infrastructure
- Maintain current firmware across all connected devices
- Shift from reactive to predictive maintenance using continuous condition monitoring
What metrics should be monitored in an industrial IoT system?
Key metrics to track include machine availability and uptime (planned vs. unplanned downtime), OEE (availability × performance × quality), and cycle time deviation from baseline. Also monitor network connectivity health—gateway latency, packet loss, device heartbeats—and individual device status such as firmware version and signal strength.
How does IoT monitoring reduce machine downtime in manufacturing?
Continuous monitoring detects early warning signals—abnormal vibration, cycle time drift, temperature spikes, connectivity interruptions—before they cause failures. This enables maintenance to be scheduled proactively based on actual equipment condition rather than triggered by breakdowns, reducing downtime by 30-50% compared to reactive approaches.
What is the difference between IoT monitoring and IIoT monitoring?
IIoT (Industrial IoT) monitoring focuses on operational technology environments: manufacturing machines, production lines, and industrial sensors. Reliability requirements, safety implications, and real-time performance demands are far more stringent than in consumer IoT, which prioritizes convenience and connectivity.
How can legacy CNC machines be integrated into an IoT monitoring system?
Legacy CNC machines connect via serial-to-Ethernet adapters and middleware that translates proprietary protocols (FANUC, Haas, Okuma) into standardized formats like MTConnect. This enables shop floor monitoring without replacing functional equipment. Validate data accuracy and connectivity stability under production load before full deployment.
How often should IIoT monitoring thresholds and alert rules be reviewed?
Review thresholds at least quarterly, and immediately whenever production processes, tooling, or machine setups change. Normal ranges vary by process, so outdated thresholds will produce either excessive false alarms or dangerous blind spots.